I was playing around with data from SMHI to see what I could visualize.
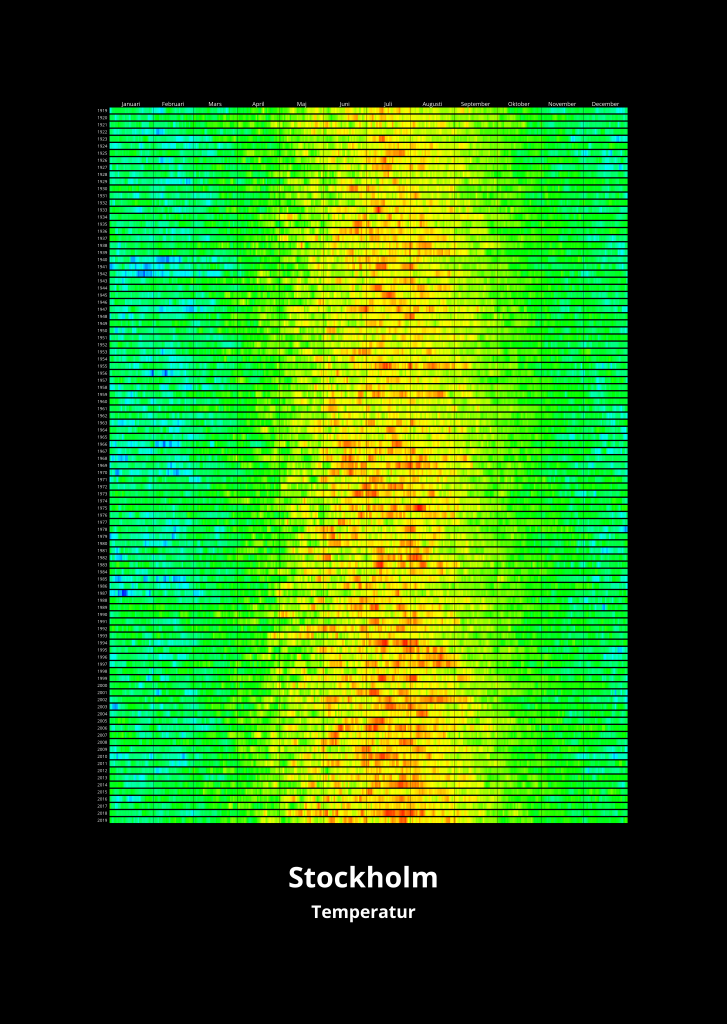
I took the temperature data at noon at the weather station at Observatorielunden in Stockholm. I then plotted the temperature for each day of the year from 1919 to 2019.
You can see when the summers have been warm and when there has been some really cold days during winter.
The picture below is done by a Python program I wrote, that reads the CSV file from SMHI, and then plots the data.
WOOOW coolt !!