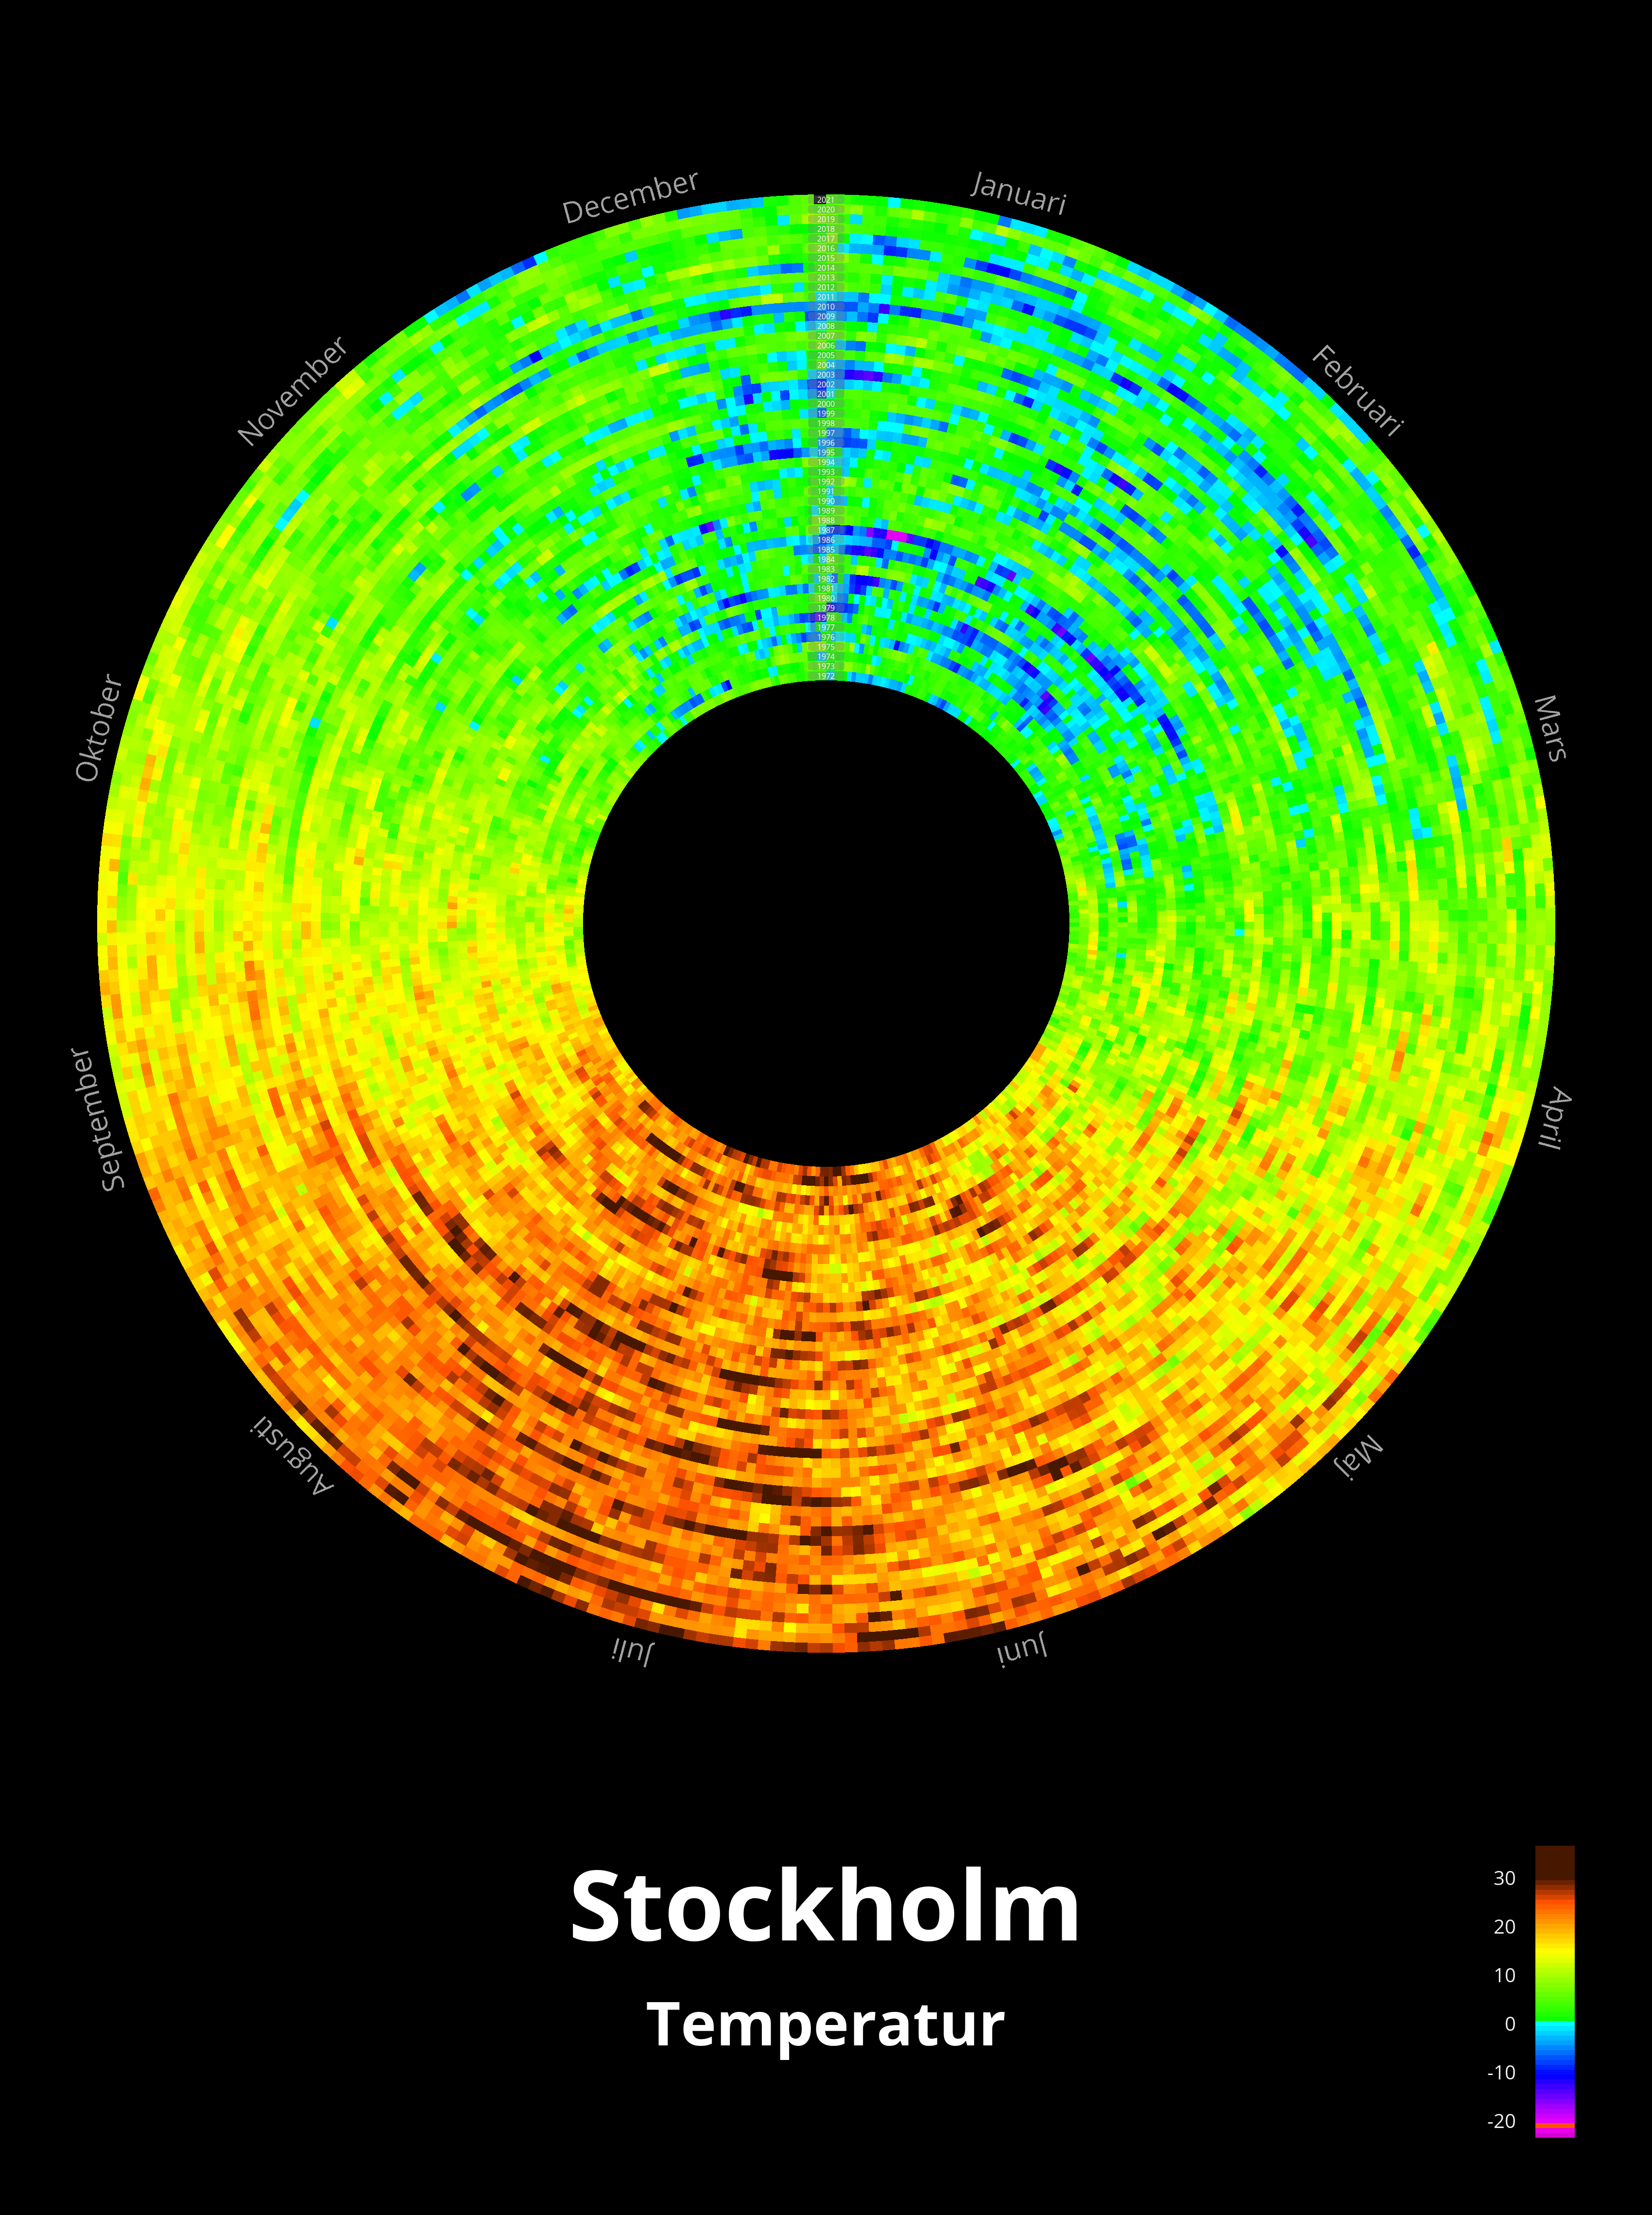
This is another take on the temperature data from Observatorielunden in Stockholm.
Instead of doing it in a matrix as in Temperature, I wanted to see what it would look like if the years were represented by circles.
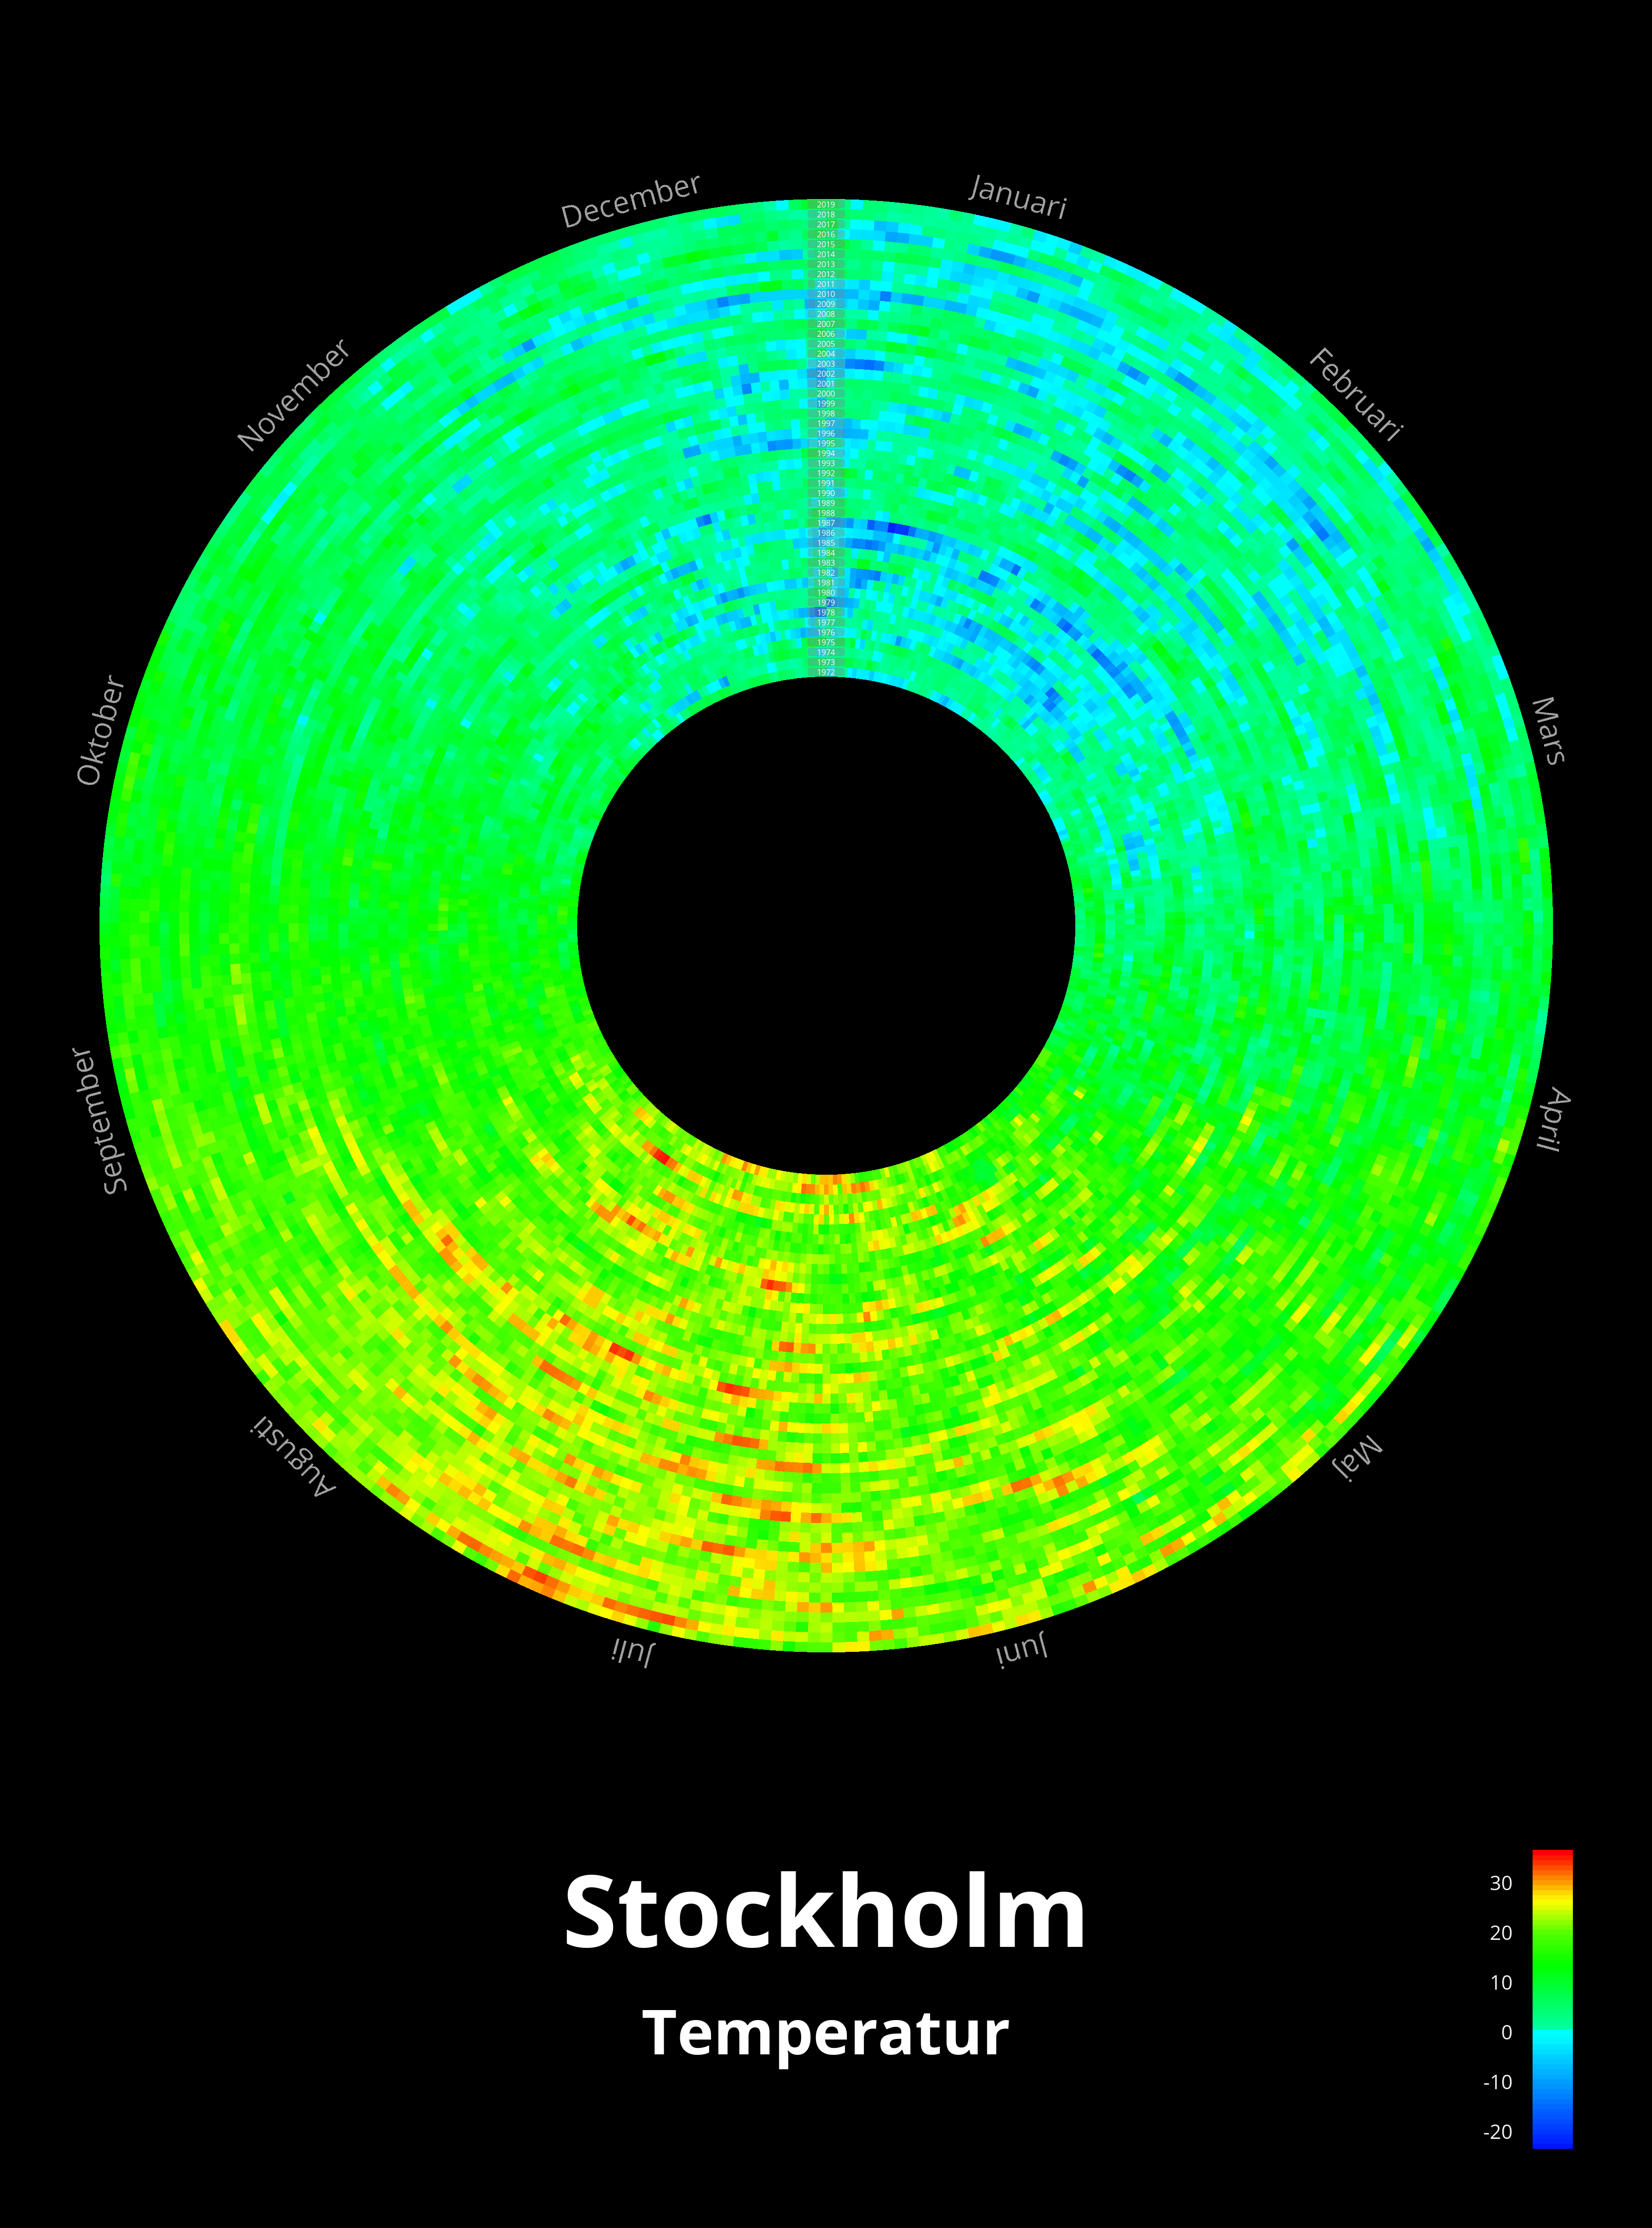
I then looked at SMHI and adapted to their temperature scale and colors: