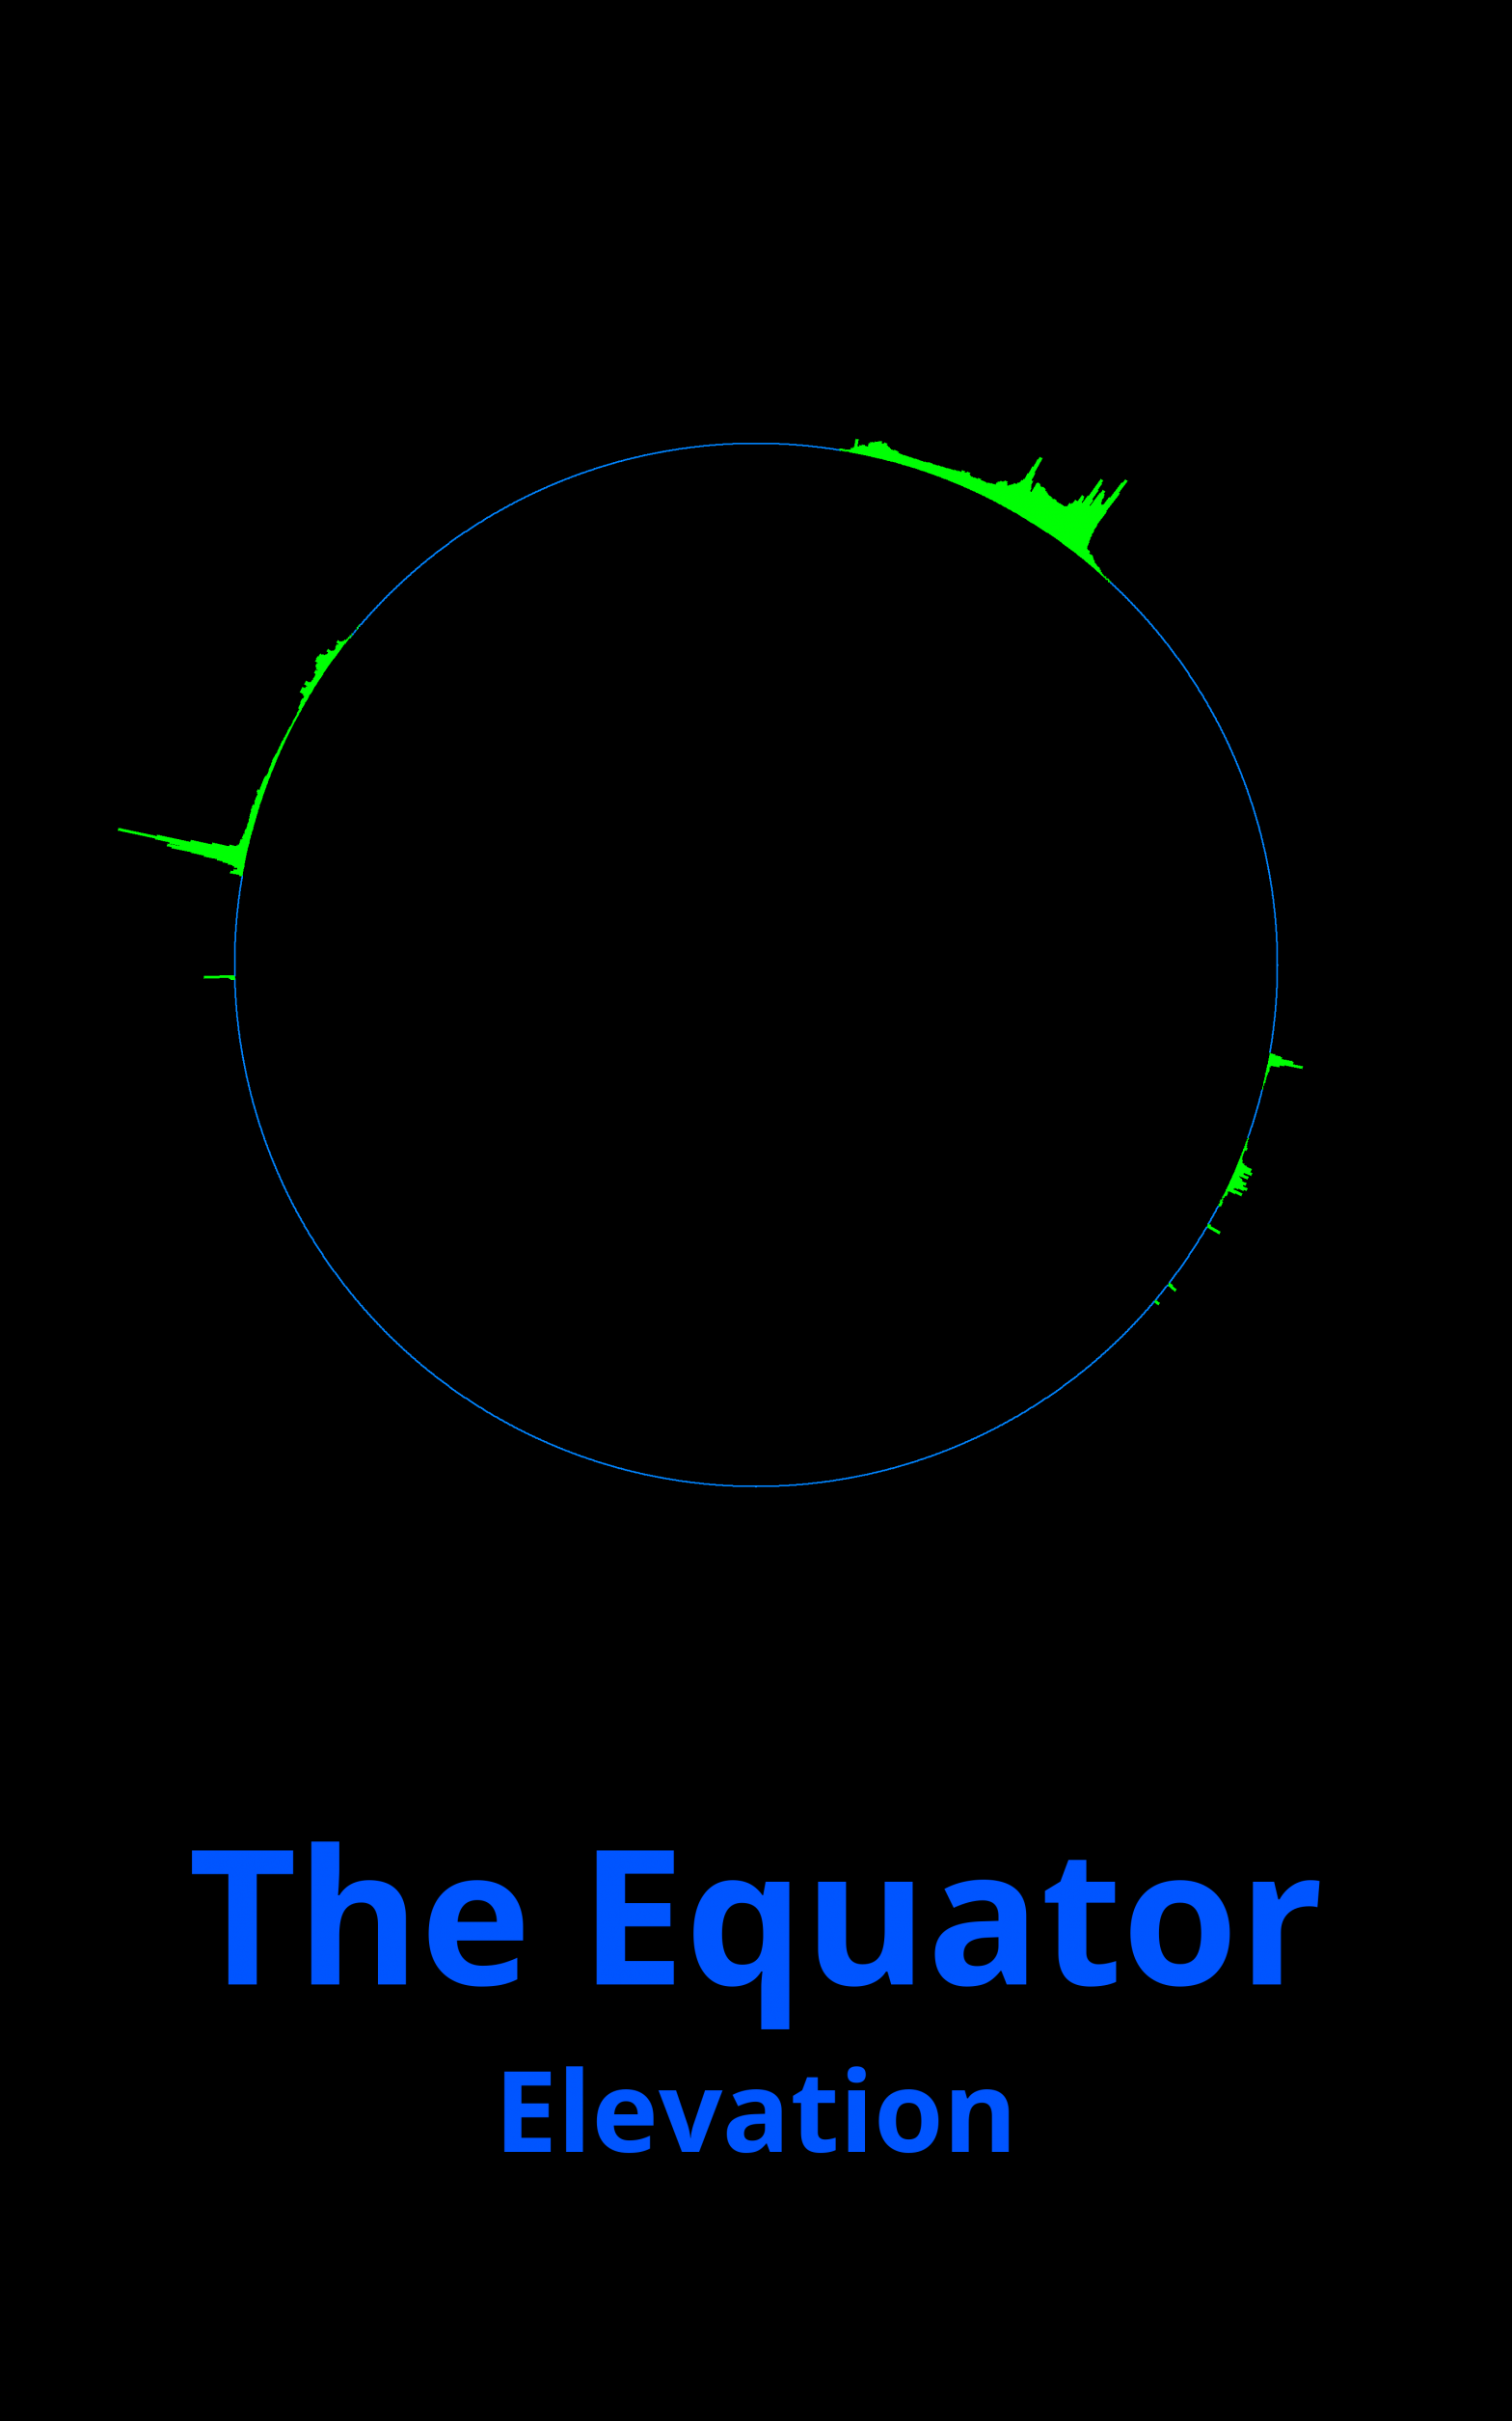
Playing around with elevation data, I put together a visualization of the elevation around the equator. The left starts at the date line in the
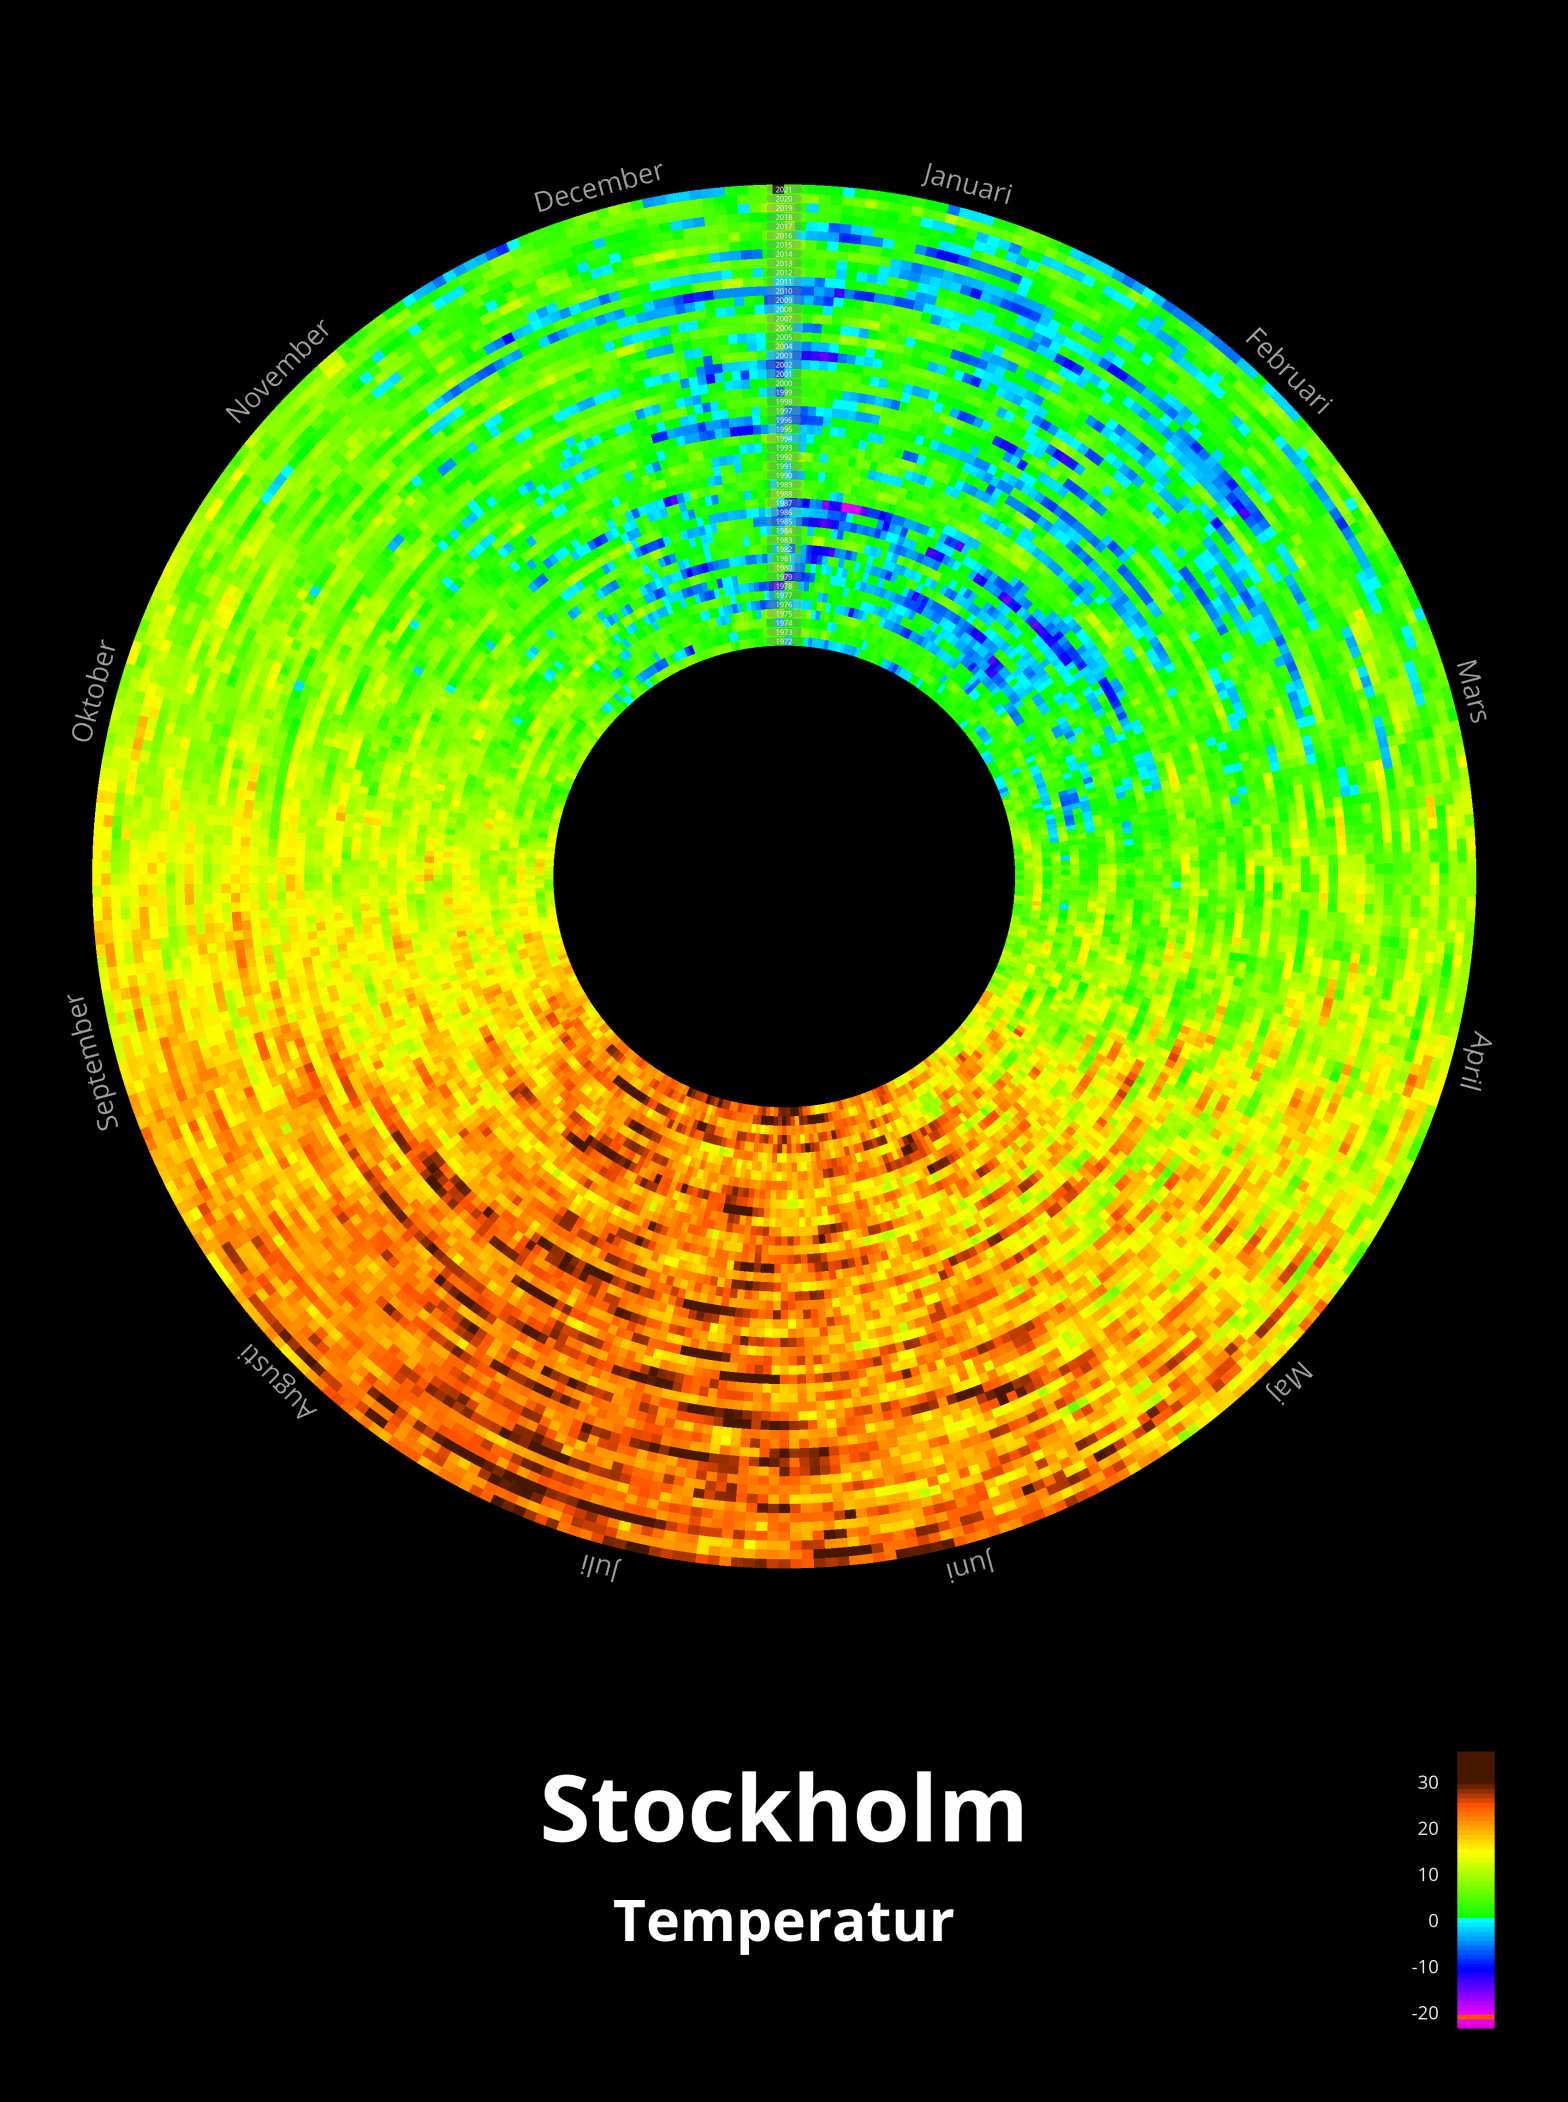
This is another take on the temperature data from Observatorielunden in Stockholm. Instead of doing it in a matrix as in Temperature, I wanted to
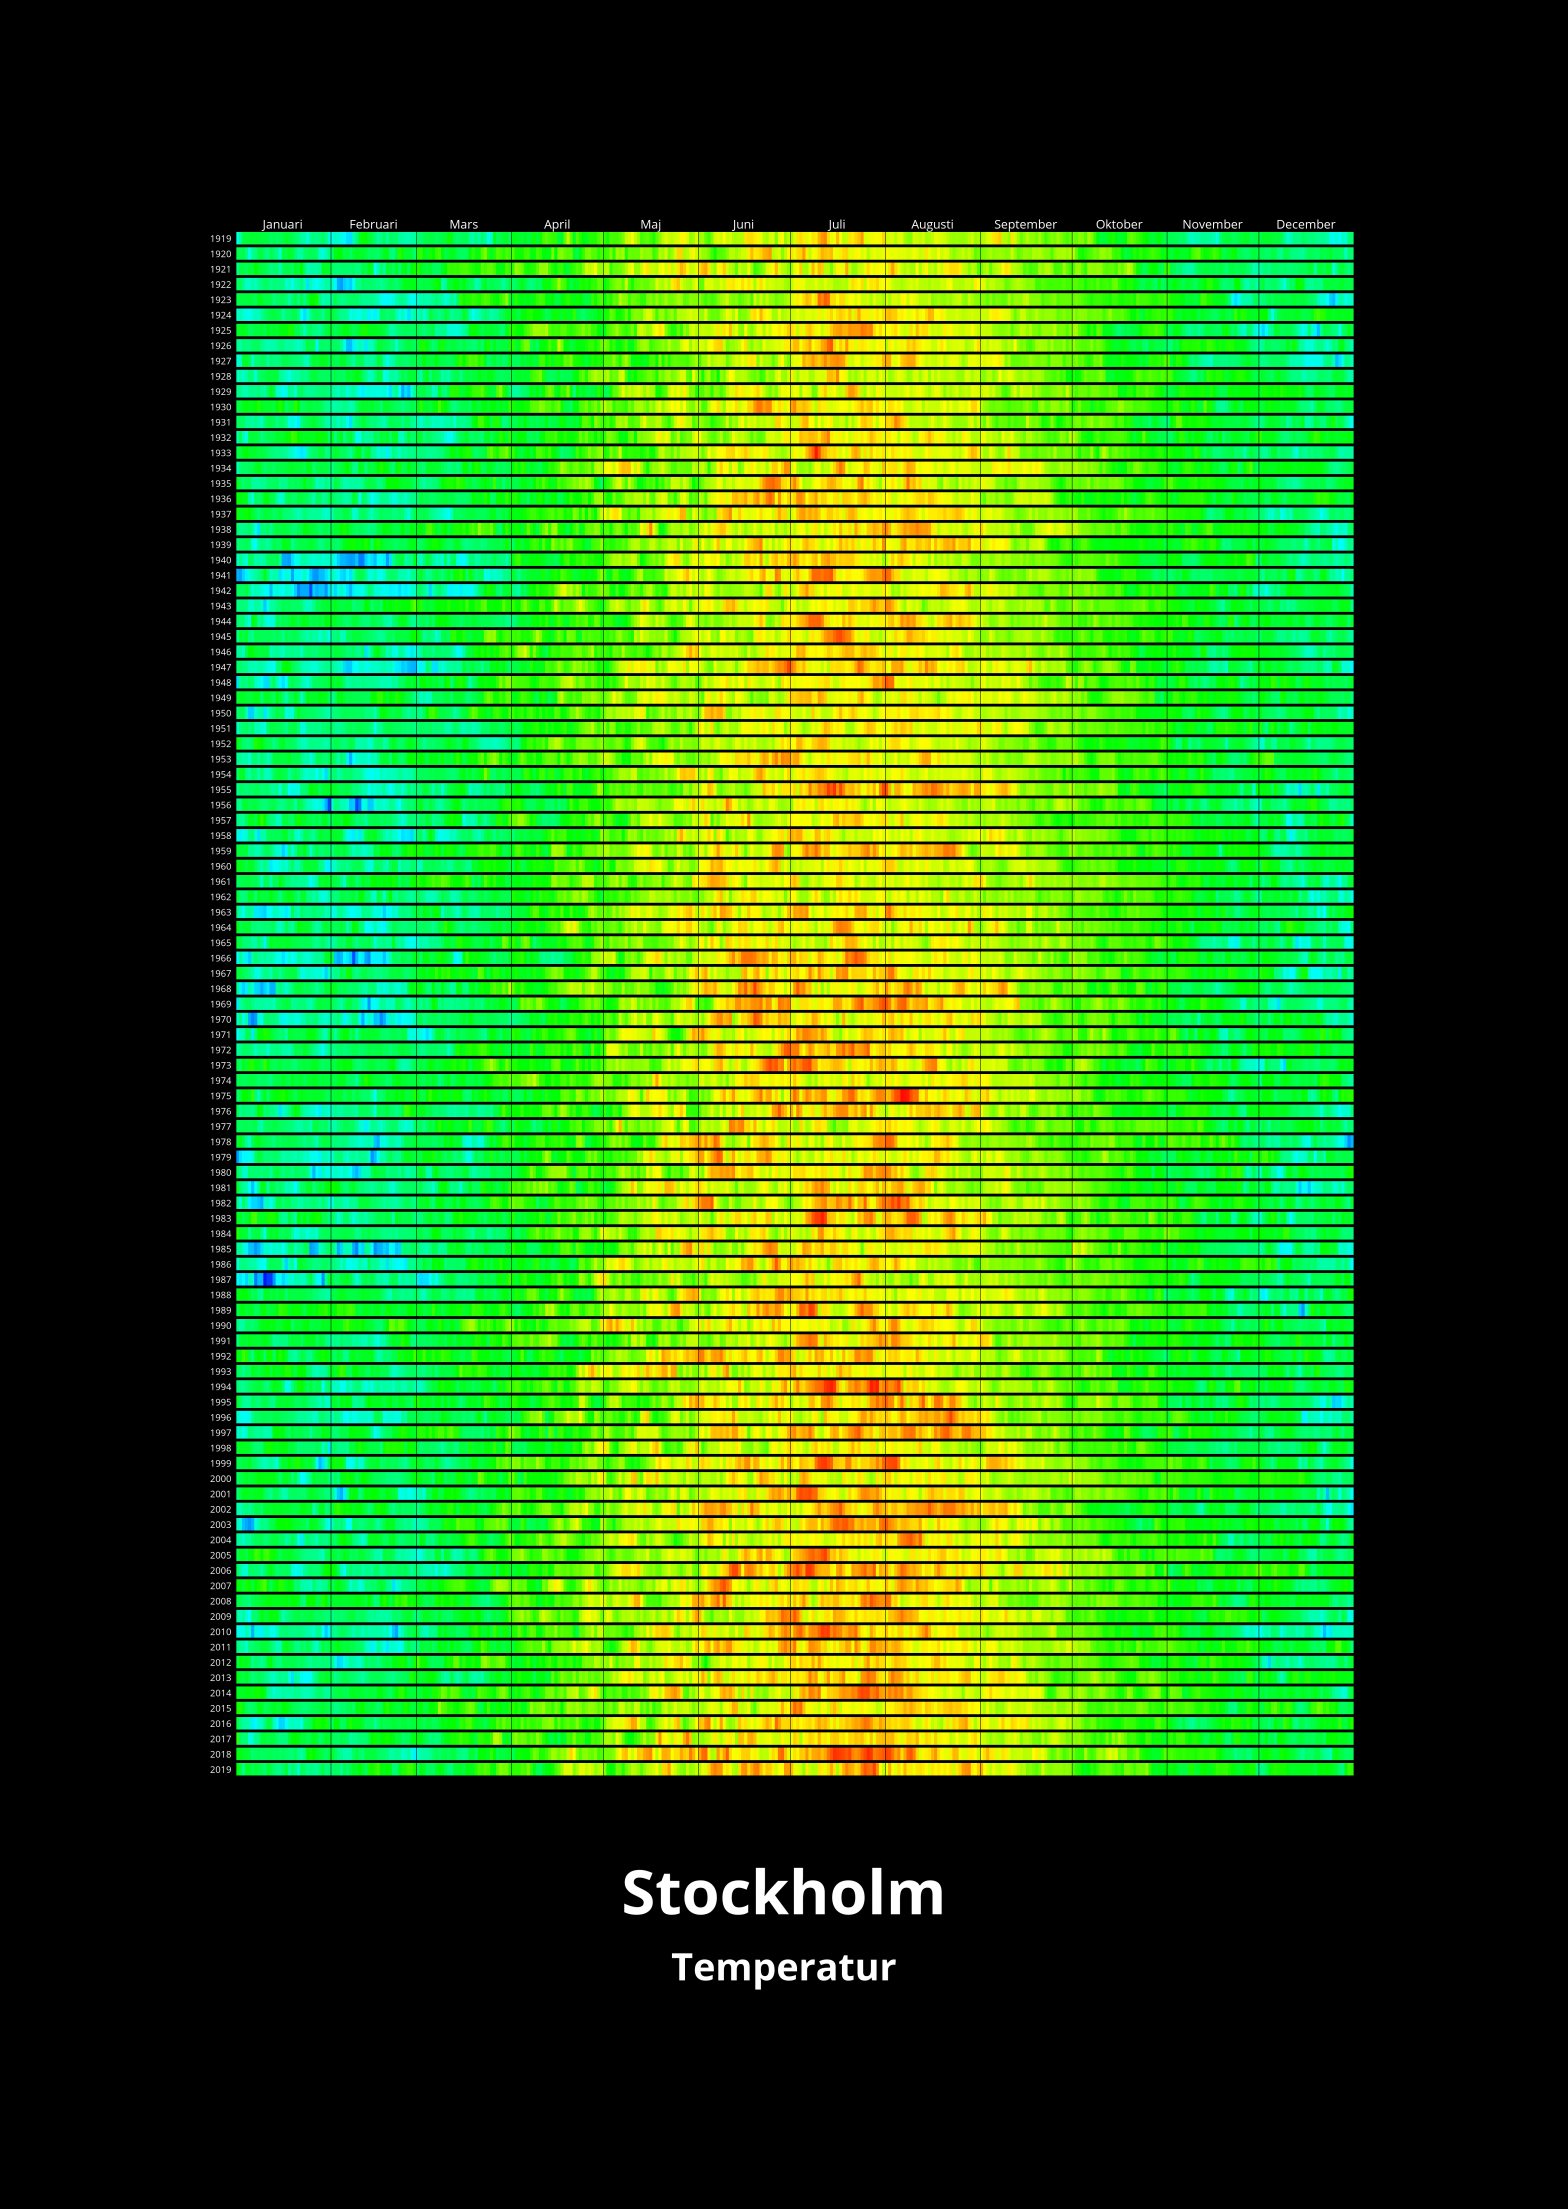
I was playing around with data from SMHI to see what I could visualize. I took the temperature data at noon at the weather station
To get better sound out of the TV, I have it connected to my stereo system. The only annoying thing was that I needed two
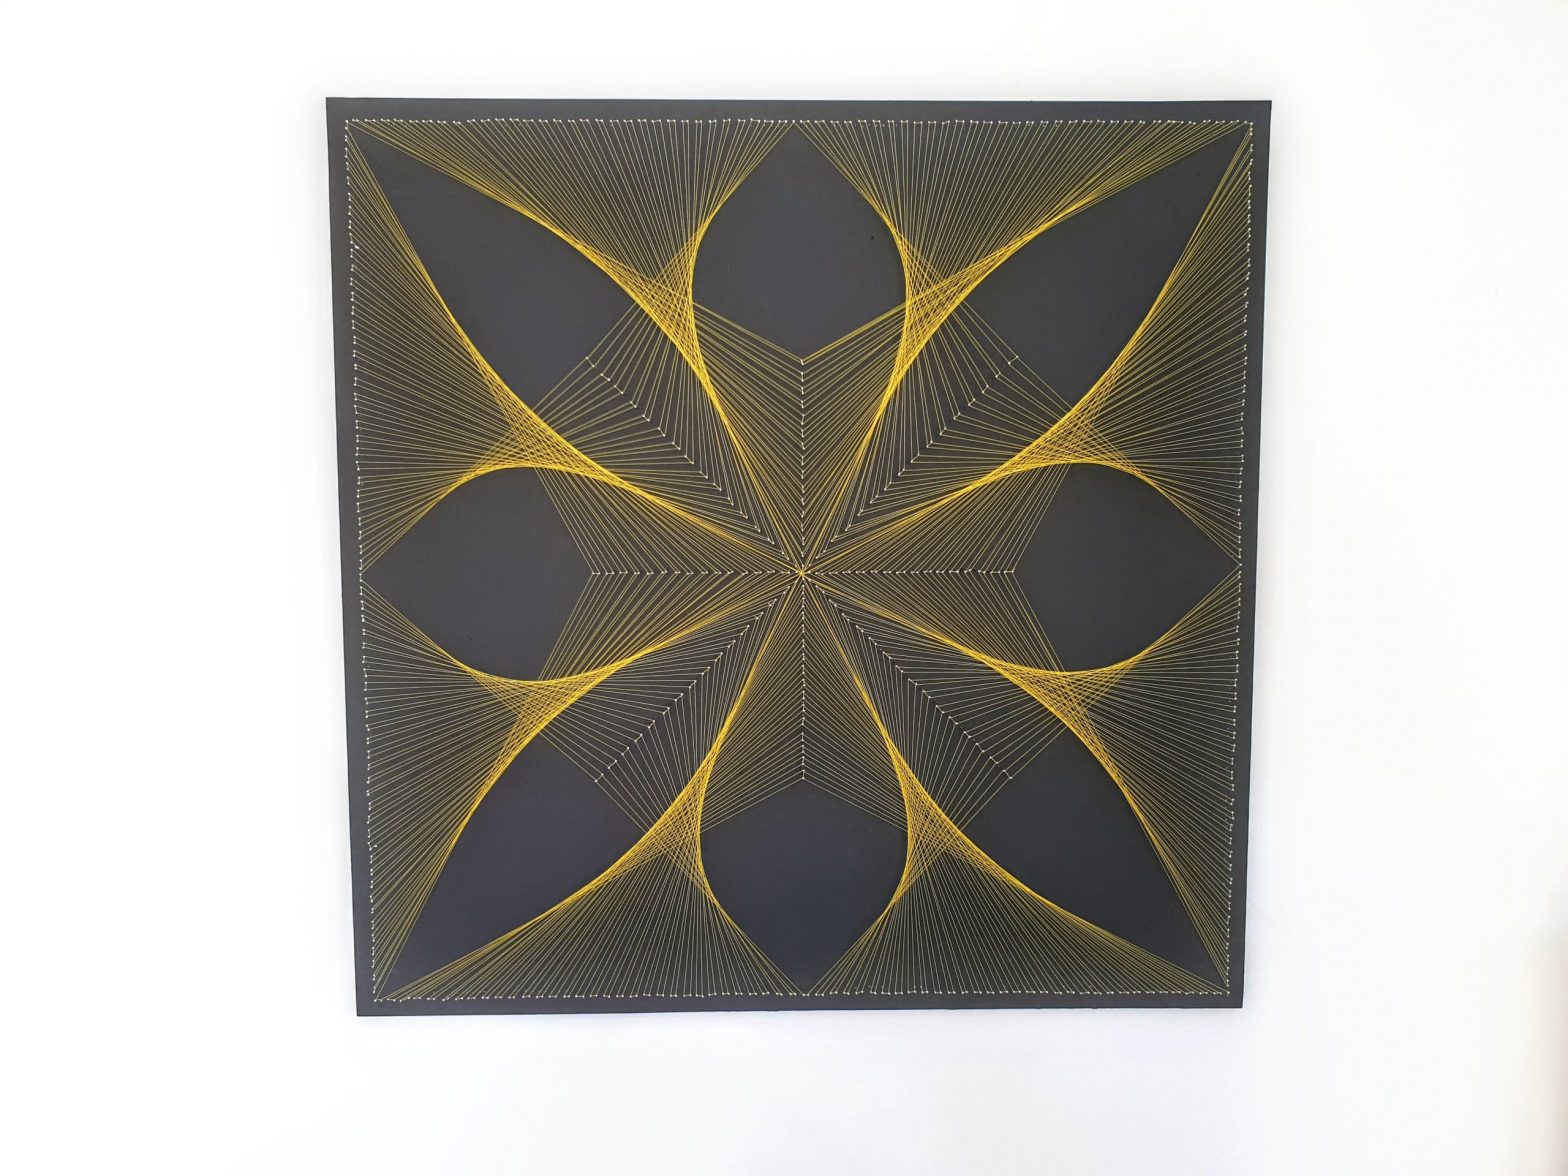
I needed something to hang on the walls in my new apartment, and kind of got into something called string art. I started with one
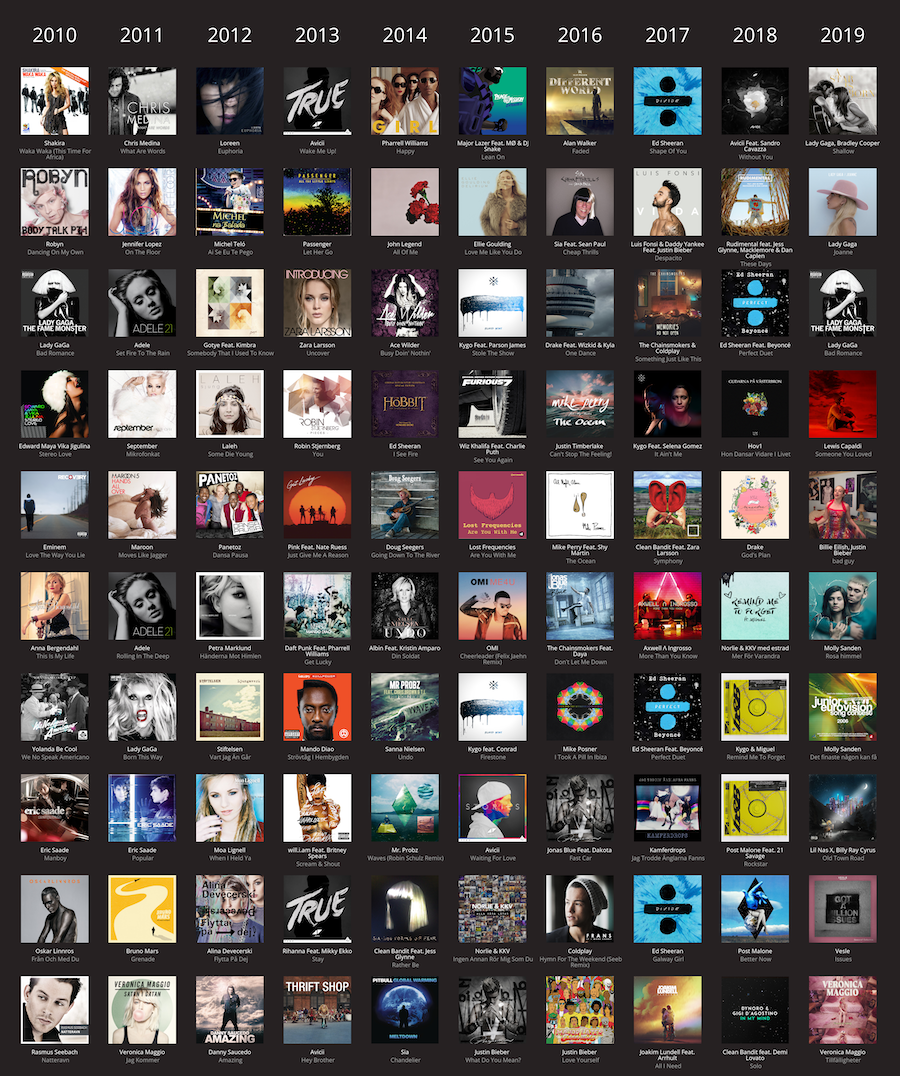
While experimenting with the Spotify API to make the visualization of album cover colors over the years, I also created a picture of the top
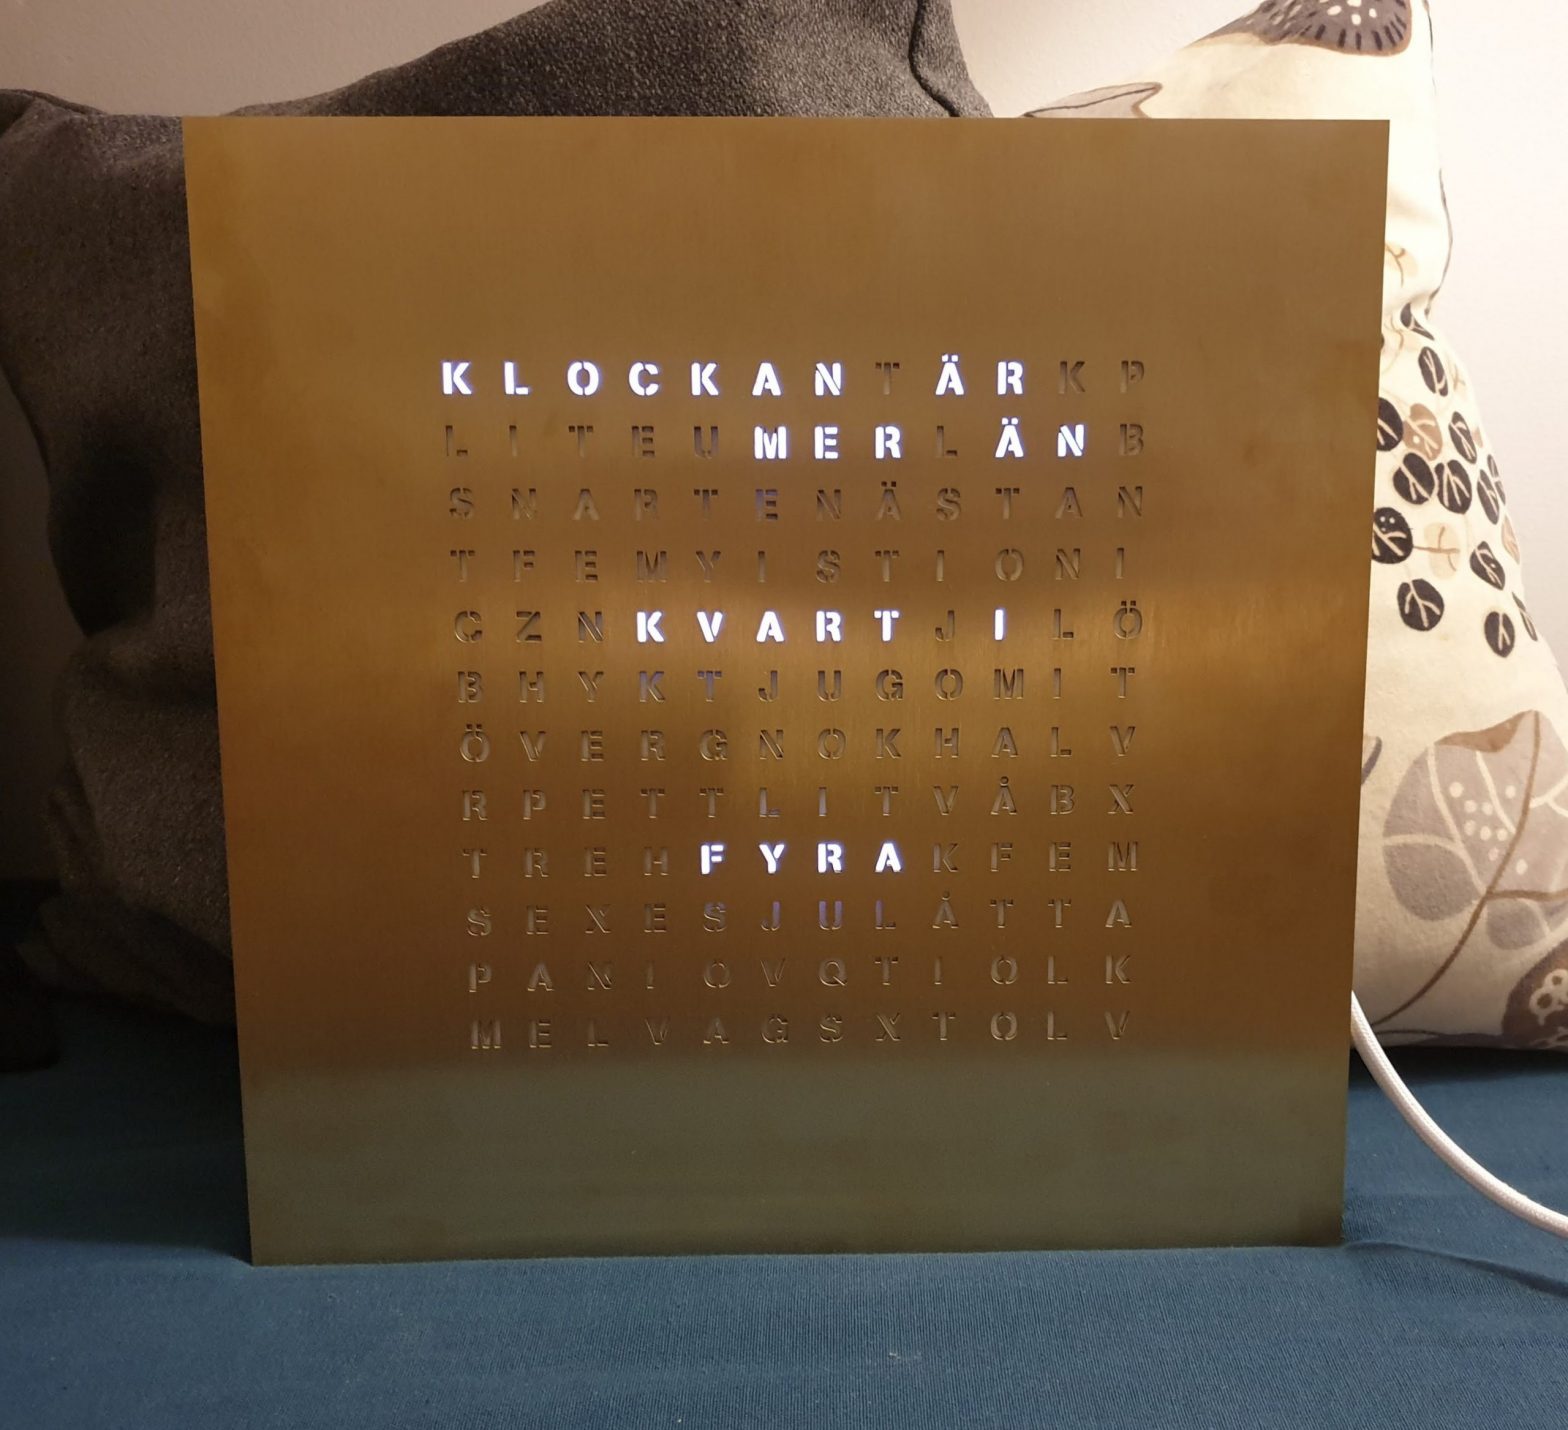
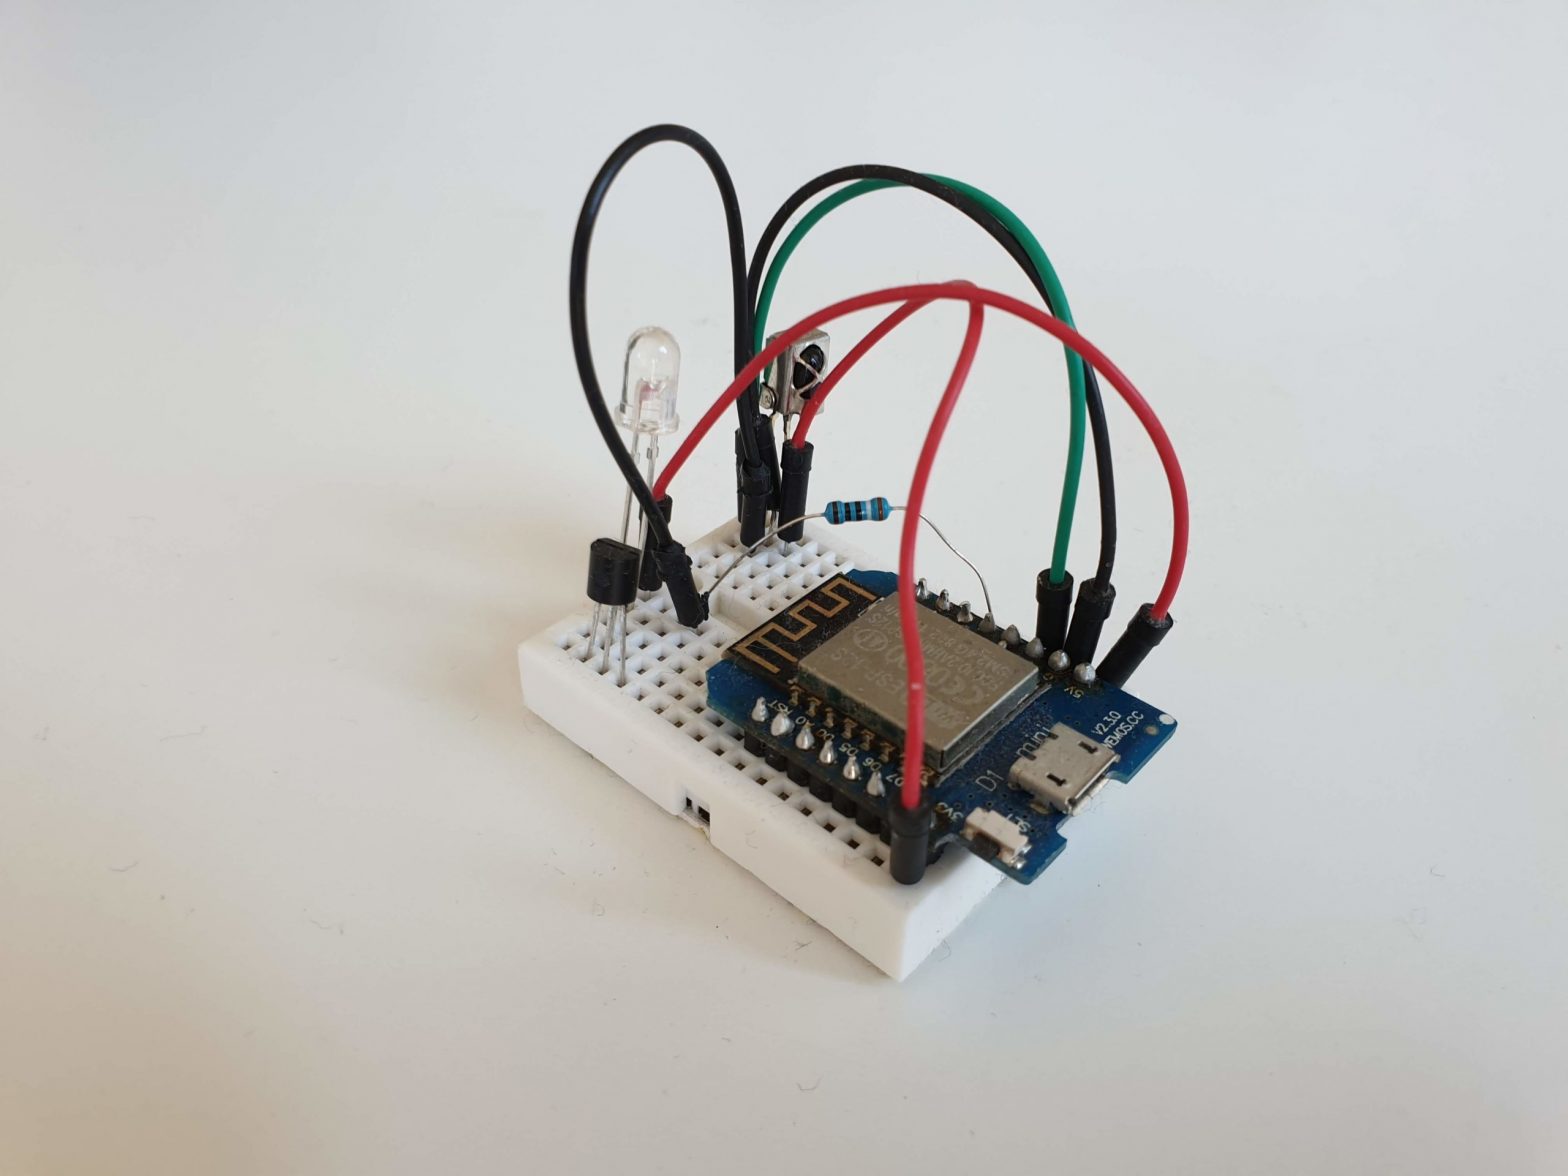
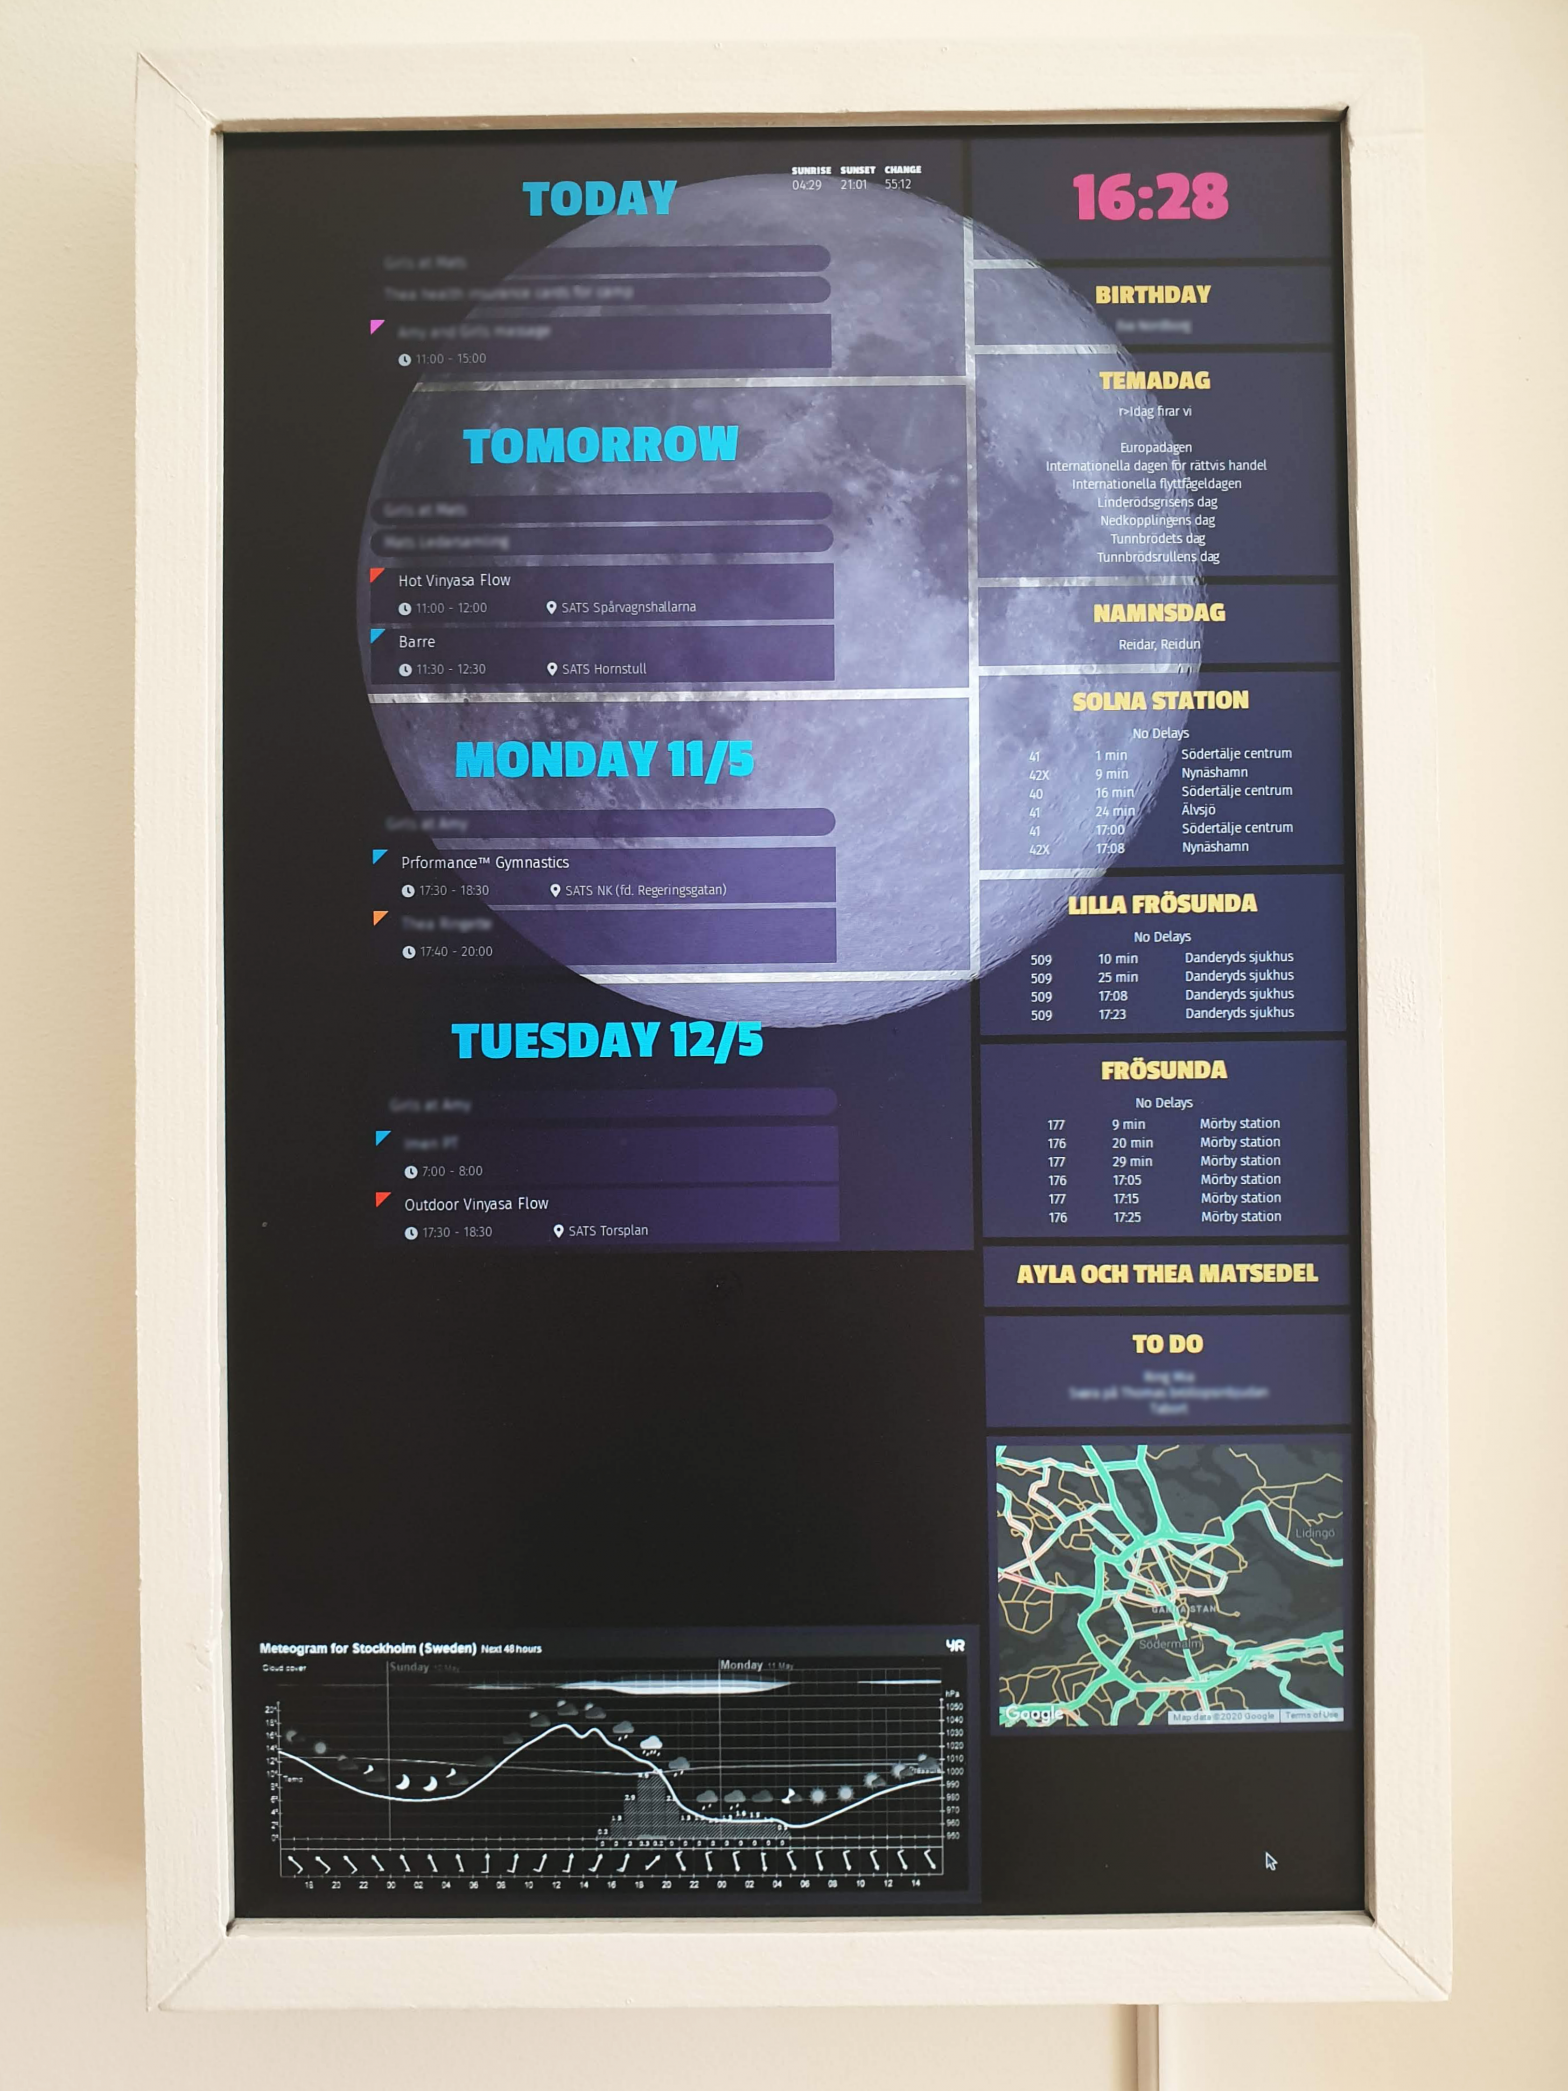
I’ve been wanting a work clock for a while. It’s a lot of work, but when Johan had seen one for sale, I took up
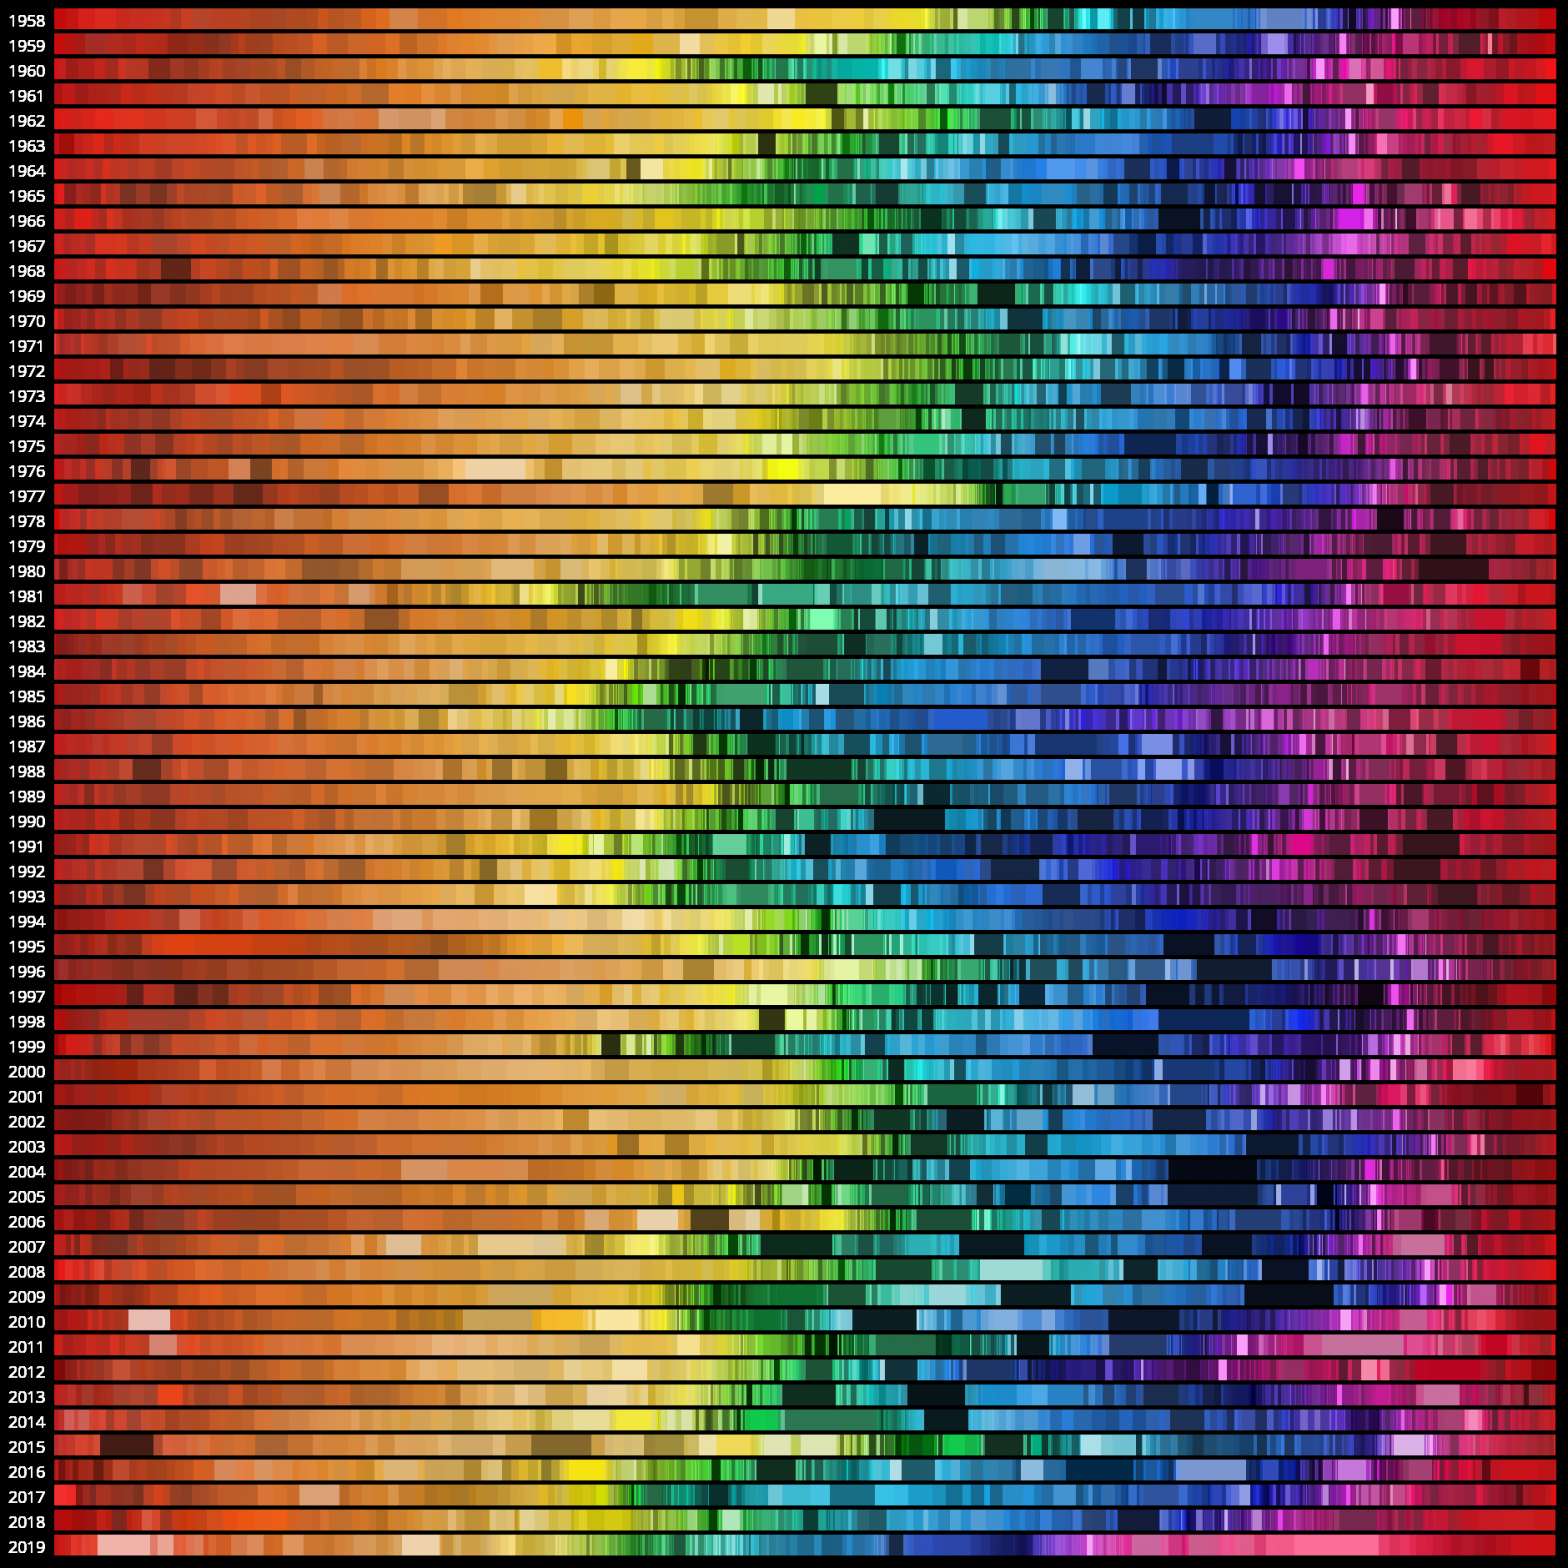
I was fascinated by the visualization that Vijay Pandurangan did about how the colors of movie posters have evolved over almost a century. It made
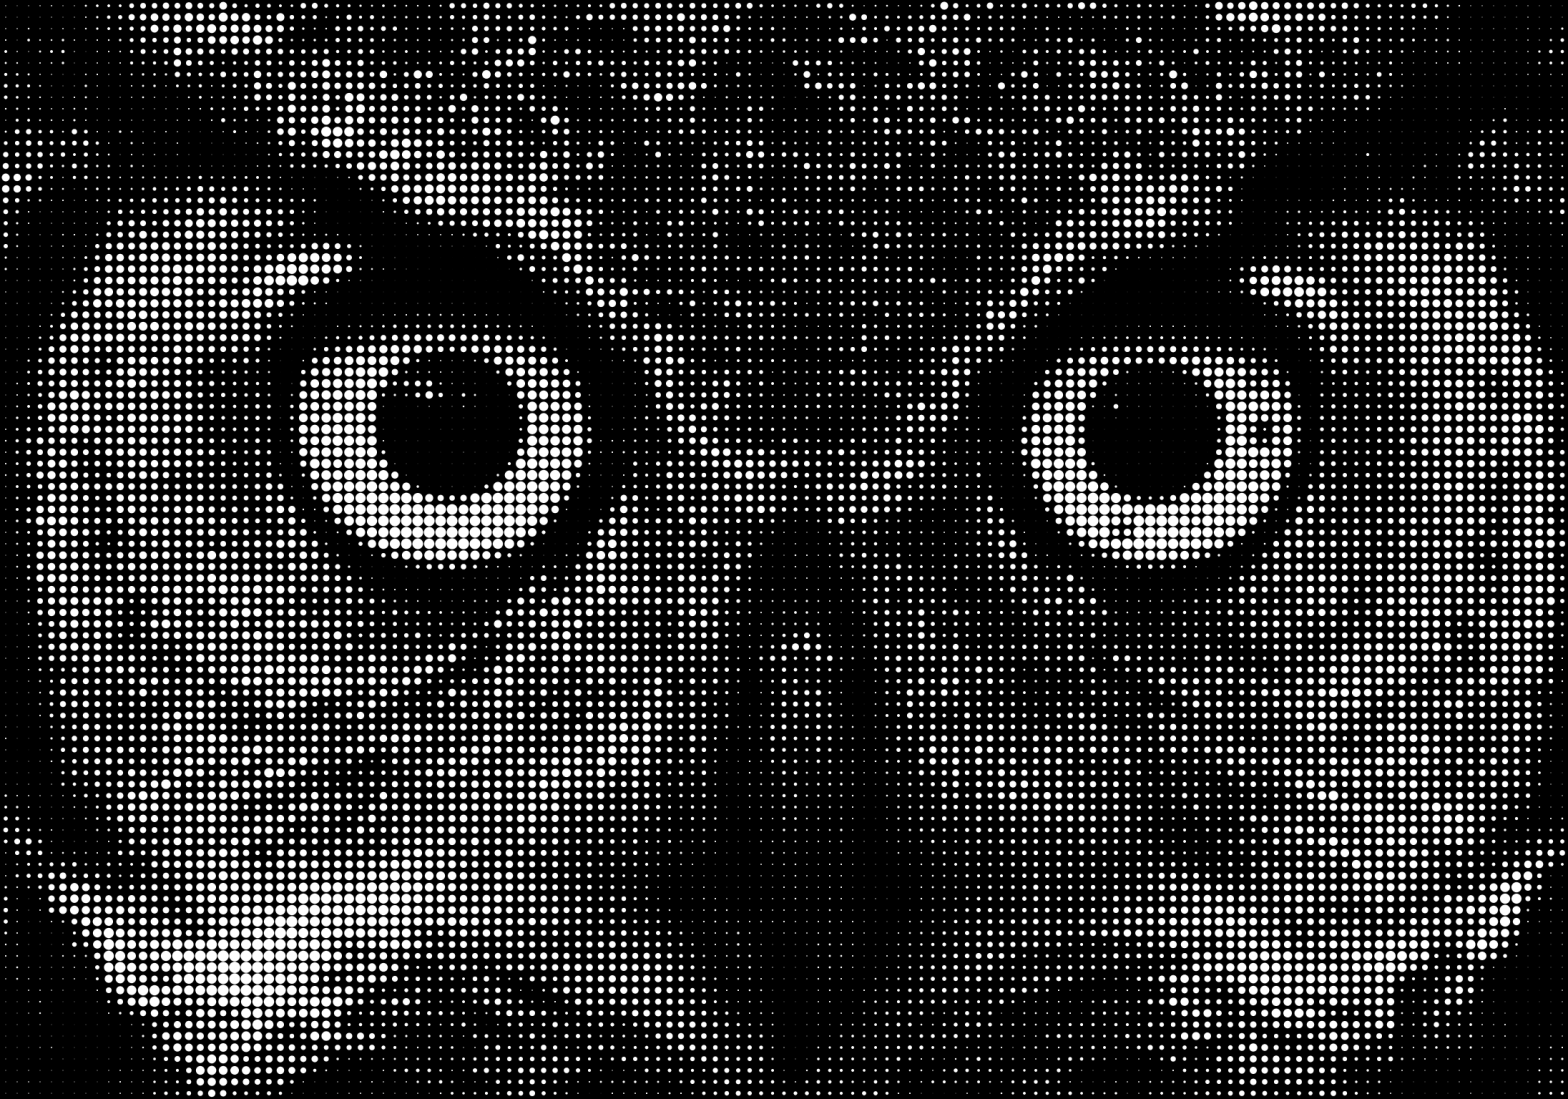
I was experimenting with the programming environment Processing and reading the pixels of an image. I then did something along the lines of: